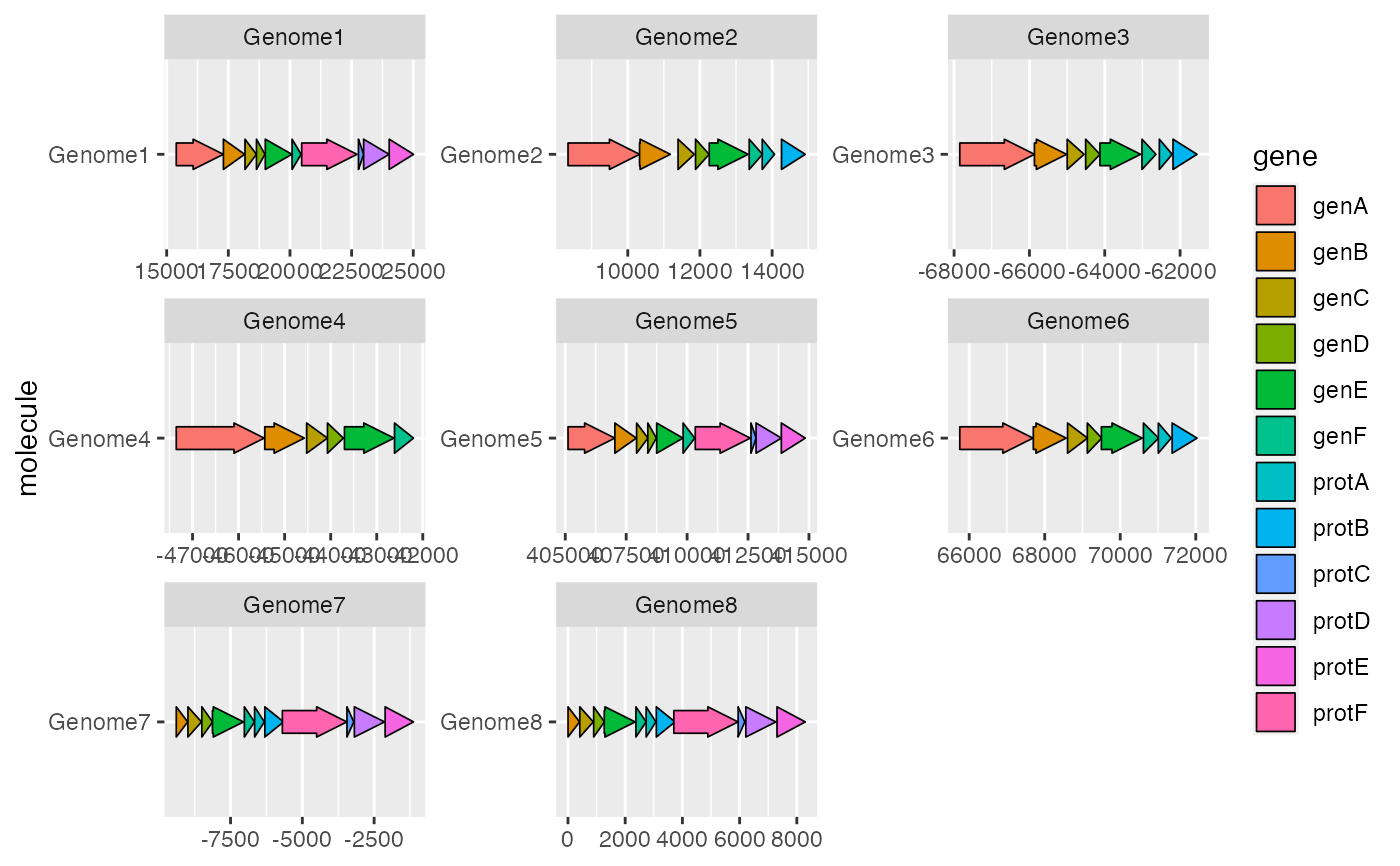
geom_gene_arrow() draws genes as arrows, allowing gene maps to be drawn.
Arguments
- mapping, data, stat, position, na.rm, show.legend, inherit.aes, ...
As standard for ggplot2.
- arrowhead_width
grid::unit()object giving the width of the arrowhead. Defaults to 4 mm. If the gene is drawn smaller than this width, only the arrowhead will be drawn, compressed to the length of the gene.- arrowhead_height
grid::unit()object giving the height of the arrowhead. Defaults to 4 mm.- arrow_body_height
grid::unit()object giving the height of the body of the arrow. Defaults to 3 mm.
Details
This geom draws genes as arrows along a horizontal line representing the
molecule. The start and end locations of the gene are expressed with the
xmin and xmax aesthetics, while the molecule can be specified with the
y aesthetic. Optionally, an additional forward aesthetic can be used to
reverse the orientation of some or all genes from that implied by xmin and
xmax.
Unless the plot is faceted with a free x scale, all the molecules will share
a common x axis. This means that if the locations are very different across
different molecules, the genes might appear very small and squished together
with a lot of unnecessary empty space. To get around this, either facet the
plot with scales = "free_x", or normalise the gene locations if their
exact locations are not important.
See make_alignment_dummies() for a method to align genes between molecules.
Aesthetics
xmin,xmax (start and end of the gene; will be used to determine gene orientation)
y (molecule)
forward (if any value that is not TRUE, or coercible to TRUE, the gene arrow will be drawn in the opposite direction to that determined by
xminandxmax)alpha
colour
fill
linetype
size
Examples
ggplot2::ggplot(example_genes, ggplot2::aes(xmin = start, xmax = end,
                                            y = molecule, fill = gene)) +
geom_gene_arrow() +
ggplot2::facet_wrap(~ molecule, scales = "free")
