Prepare dummy data to visually align a single gene across faceted molecules
Source:R/make_alignment_dummies.R
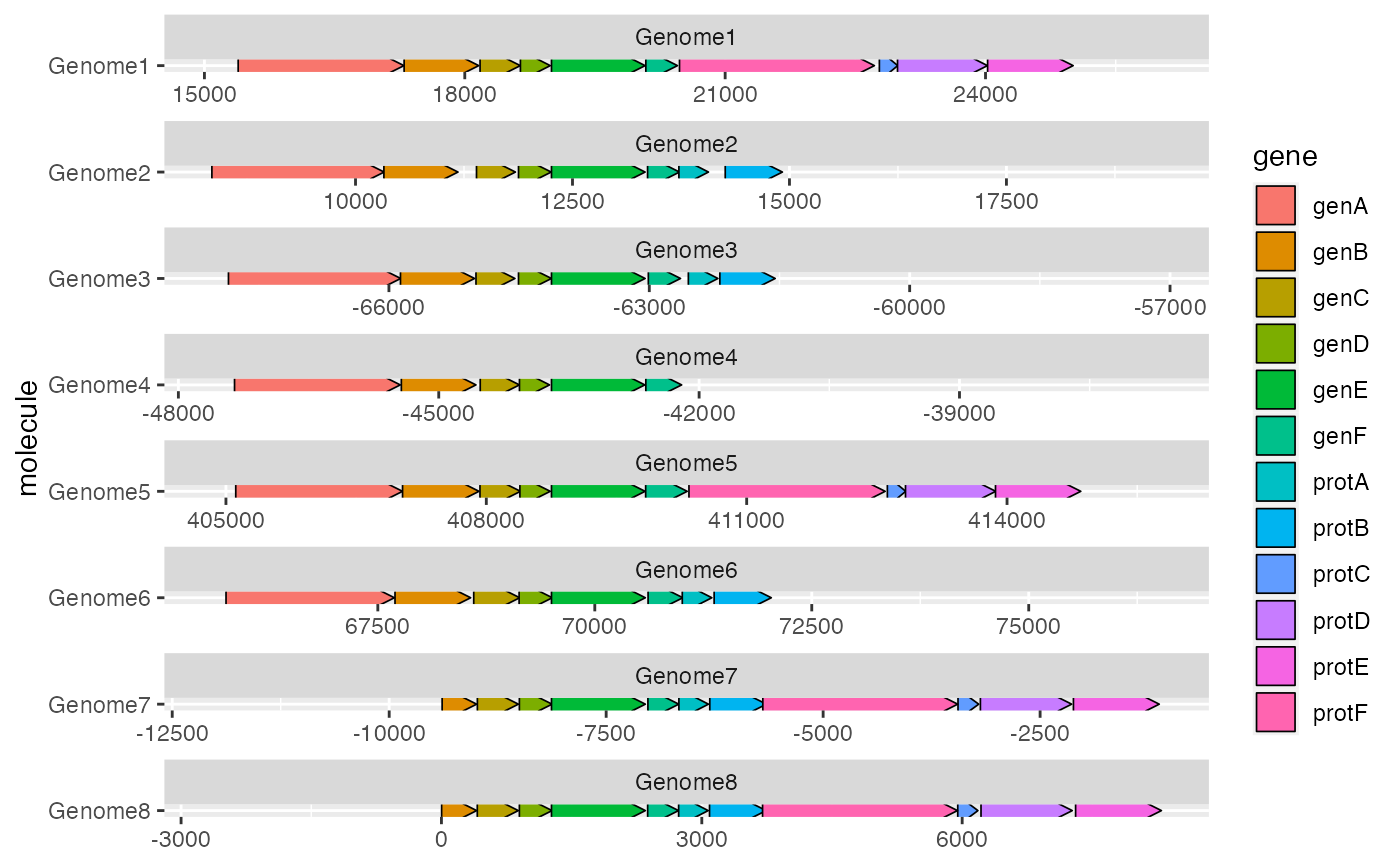
make_alignment_dummies.Rdmake_alignment_dummies() helps you to visually align genes across
molecules that have been faceted with a free x scale. The output of this
function is a data frame of dummy genes. If these dummy genes are added to a
'ggplot2' plot with ggplot::geom_blank(), they will extend the x axis
range in such a way that the start or end of a selected gene is visually
aligned across the facets.
Arguments
- data
Data frame of genes. This is almost certainly the same data frame that will later be passed to
ggplot2::ggplot().- mapping
Aesthetic mapping, created with
ggplot2::aes(). Must contain the following aesthetics:xmin,xmax,y, andid(a unique identifier for each gene).- on
Name of gene to be visually aligned across facets. This gene must be present in 'data', in the column mapped to the
idaesthetic.- side
Should the visual alignment be of the 'left' (default) or 'right' side of the gene?
Examples
dummies <- make_alignment_dummies(example_genes, ggplot2::aes(xmin = start,
  xmax = end, y = molecule, id = gene), on = "genE")

ggplot2::ggplot(example_genes, ggplot2::aes(xmin = start, xmax = end,
    y = molecule, fill = gene)) +
  geom_gene_arrow() +
  ggplot2::geom_blank(data = dummies) +
  ggplot2::facet_wrap(~ molecule, scales = "free", ncol = 1)