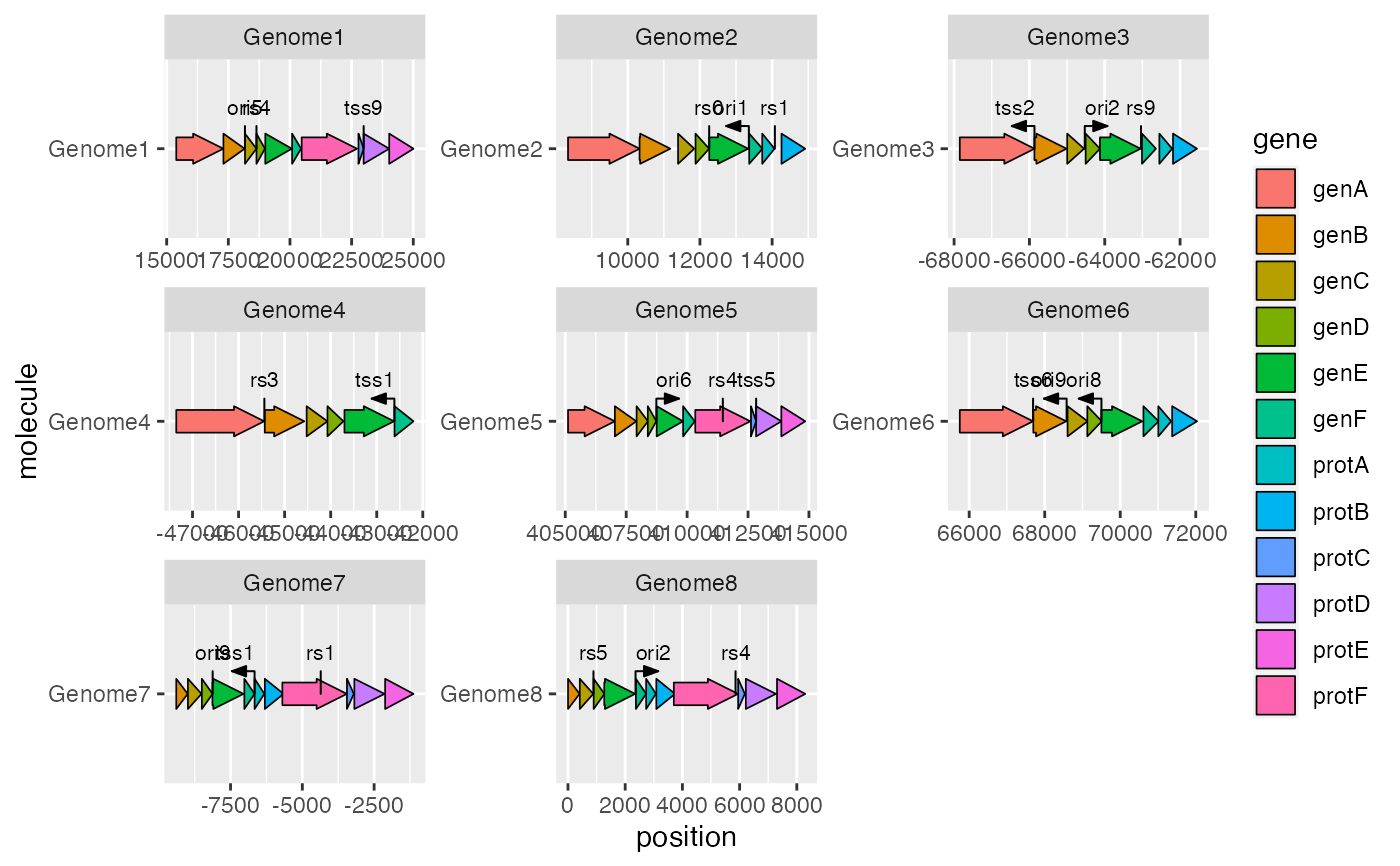
A 'ggplot2' geom to add text labels to point genetic features
Source:R/geom_feature_label.R
geom_feature_label.Rdgeom_feature_label() adds text labels to features drawn with
geom_feature().
Arguments
- mapping, data, stat, position, na.rm, show.legend, inherit.aes, ...
As standard for ggplot2. inherit.aes is set to FALSE by default, as features are not likely to share any plot aesthetics other than y.
- feature_height
grid::unit()object giving the offset from the molecule line to the inner edge of the label's bounding box. Can be set as a negative value to position labels on the opposite side of the molecule line. Defaults to 4 mm, which provides a 1 mm gap between feature and label when used with the defaultfeature_heightofgeom_feature()(3 mm).- label_height
grid::unit()object giving the height of the label text. Defaults to 3 mm.
Aesthetics
x (required; position of the feature)
y (required; molecule)
label (required; the label text)
forward (optional; will draw text in the appropriate location for features with angled arrowheads)
colour
size
alpha
family
fontface
angle
Examples
ggplot2::ggplot(example_genes, ggplot2::aes(xmin = start, xmax = end,
                                            y = molecule, fill = gene)) +
  geom_gene_arrow() +
  geom_feature(data = example_features, ggplot2::aes(x = position, y = molecule,
                                                     forward = forward)) +
  geom_feature_label(data = example_features,
                     ggplot2::aes(x = position, y = molecule, label = name,
                                  forward = forward)) +
  ggplot2::facet_wrap(~ molecule, scales = "free")