geom_feature() draws lines to indicate the positions of point genetic
features, for example restriction sites, origins of replication or
transcription start sites.
Arguments
- mapping, data, stat, position, na.rm, show.legend, inherit.aes, ...
As standard for ggplot2. inherit.aes is set to FALSE by default, as features are not likely to share any plot aesthetics other than y.
- feature_height
grid::unit()object giving the height of a feature above the molecule line. Can be set as a negative value to draw features below the line. Defaults to 3 mm.- feature_width
grid::unit()object giving the width of a feature (distance from the elbow to the tip of the arrow). Only relevant for oriented features. Defaults to 3 mm.- arrowhead_width
grid::unit()object giving the width of the arrowhead indicating the direction of an oriented feature. Only relevant for oriented features. Defaults to 2 mm.
Details
Features are drawn as vertical lines extending from the horizontal line
representing the molecule. The position of the feature is expressed with the
x aesthetic. Optionally, the forward aesthetic can be used to specific
an orientation for the feature (e.g. the direction of transcription), in
which case an angled arrowhead will be added. The forward aesthetic
assumes that the x-axis is oriented in the normal direction, i.e. increasing
from left to right; if it is not, the values in forward will need to be
inverted manually.
Aesthetics
x (required; position of the feature)
y (required; molecule)
forward (optional; if TRUE, or a value coercible to TRUE, the feature will be drawn with an arrowhead pointing right, if FALSE, pointing left, if NA, the feature will be drawn as a vertical line)
alpha
colour
linetype
linewidth (the former size aesthetic has been deprecated and will be removed in future versions)
Note that, unlike geom_gene_arrow() and ggplot2 convention, linewidth in
geom_feature() is expressed in points rather than millimetres, with a
default value of 1. This inconsistency is retained for backwards
compatibility, and will be reconciled when these point-feature geoms are
superseded in gggenes 1.0.0.
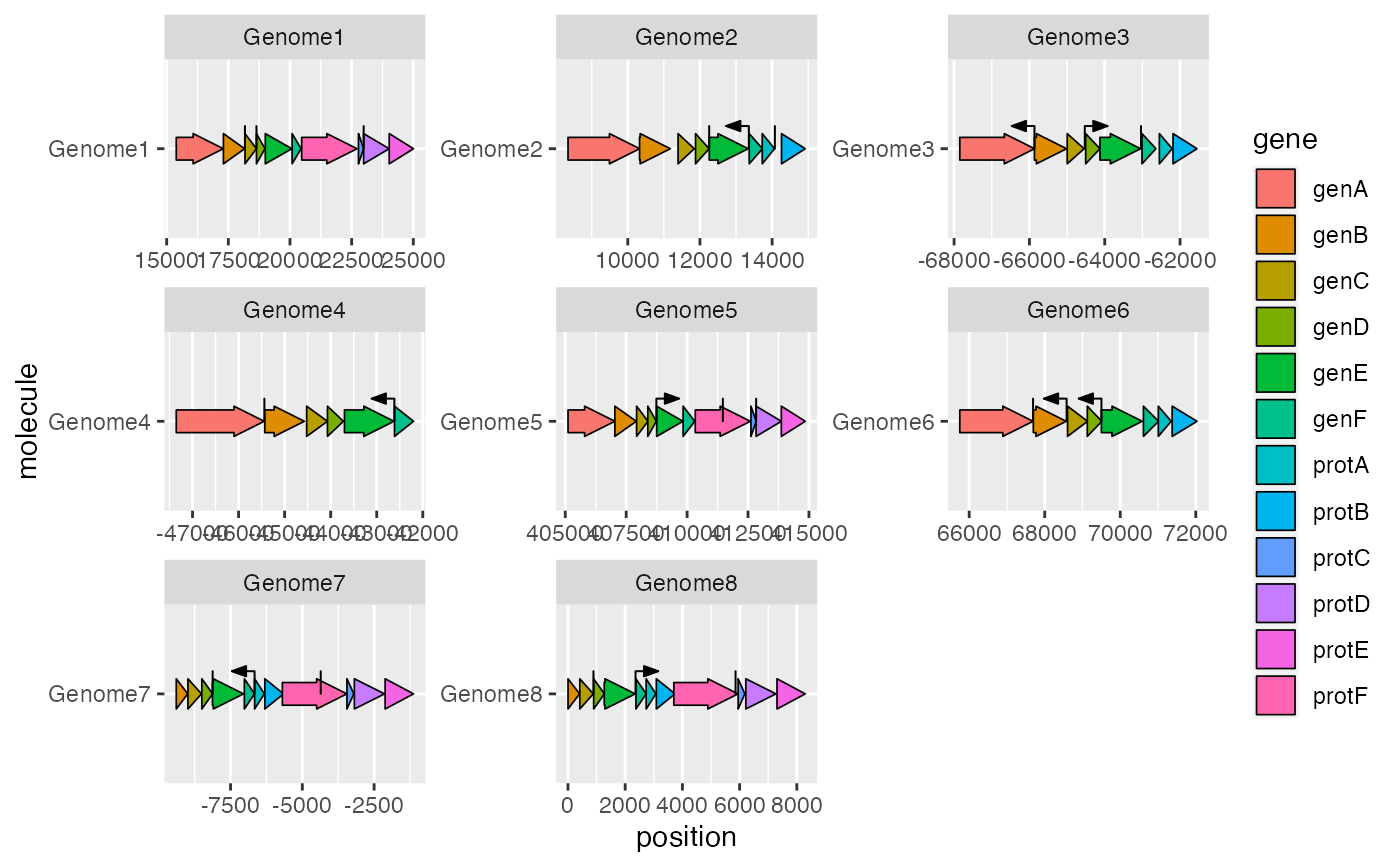
Examples
ggplot2::ggplot(example_genes, ggplot2::aes(xmin = start, xmax = end,
                                            y = molecule, fill = gene)) +
  geom_gene_arrow() +
  geom_feature(data = example_features, ggplot2::aes(x = position, y = molecule,
                                                     forward = forward)) +
  ggplot2::facet_wrap(~ molecule, scales = "free")