A 'ggplot2' geom to draw subgene segments of gene arrows
Source:R/geom_subgene_arrow.R
geom_subgene_arrow.Rdgeom_subgene_arrow() draws subgenes segments within gene arrows drawn with
geom_gene_arrow().
Arguments
- mapping, data, stat, position, na.rm, show.legend, inherit.aes, ...
As standard for 'ggplot2'.
- arrowhead_width
grid::unit()object giving the width of the arrowhead. Defaults to 4 mm. If the gene is drawn smaller than this width, only the arrowhead will be drawn, compressed to the length of the gene.- arrowhead_height
grid::unit()object giving the height of the arrowhead. Defaults to 4 mm.- arrow_body_height
grid::unit()object giving the height of the body of the arrow. Defaults to 3 mm.
Details
The start and end locations of the subgene are given with the xsubmin and
xsubmax aesthetics. geom_subgene_arrow() requires some information about
the 'parent' gene, provided with the same aesthetics used for
geom_gene_arrow(): start and end locations of the 'parent' gene with the
xmin and xmax aesthetics, the molecule with the y aesthetic, and
optionally the direction with the forward aesthetic. If the geometry of
the parent gene has been changed with arrowhead_width, arrowhead_height
or arrow_body_height, identical parameters should be given to
geom_subgene_arrow().
Aesthetics
xmin,xmax (start and end of the gene; will be used to determine gene orientation)
xsubmin,xsubmax (start and end of subgene segment). Should be consistent with
xmin/xmaxy (molecule)
forward (if FALSE, or coercible to FALSE, the gene arrow will be drawn in the opposite direction to that determined by
xminandxmax)alpha
colour
fill
linetype
linewidth (the former size aesthetic has been deprecated and will be removed in future versions)
Examples
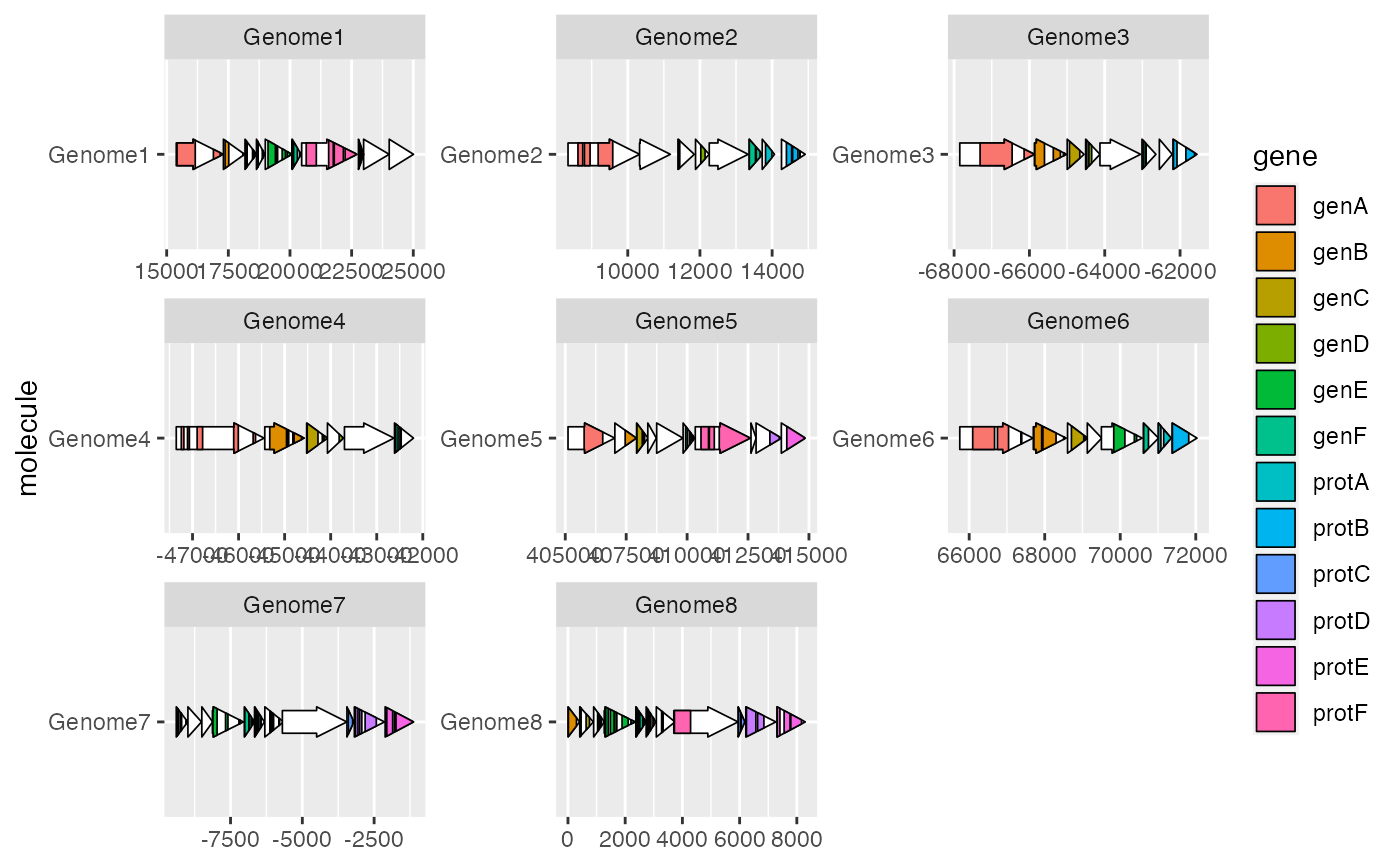
ggplot2::ggplot(example_genes, ggplot2::aes(xmin = start, xmax = end,
                                            y = molecule)) +
geom_gene_arrow() +
geom_subgene_arrow(data = example_subgenes,
      ggplot2::aes(xmin = start, xmax = end, xsubmin = from, xsubmax = to,
                   y = molecule, fill = gene)) +
ggplot2::facet_wrap(~ molecule, scales = "free")