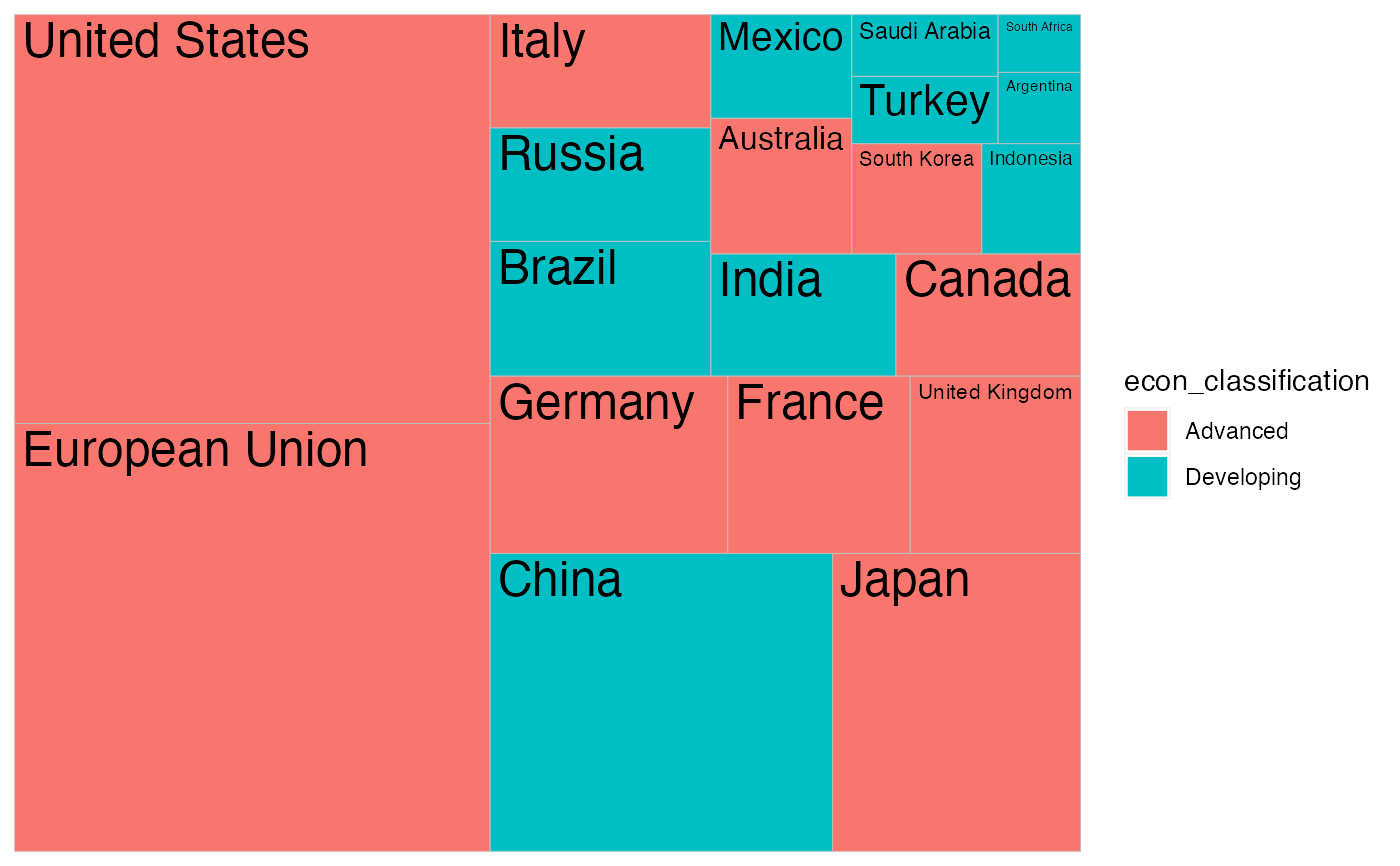
A 'ggplot2' geom to add text labels to treemap tiles.
Source:R/geom_treemap_text.R
geom_treemap_text.Rdgeom_treemap_text() can be used to add a text label to each tile in a
treemap created with geom_treemap().
Usage
geom_treemap_text(
  mapping = NULL,
  data = NULL,
  stat = "identity",
  position = "identity",
  na.rm = FALSE,
  show.legend = FALSE,
  inherit.aes = TRUE,
  padding.x = grid::unit(1, "mm"),
  padding.y = grid::unit(1, "mm"),
  place = "topleft",
  min.size = 4,
  grow = FALSE,
  reflow = FALSE,
  fixed = NULL,
  layout = "squarified",
  start = "bottomleft",
  ...
)
Arguments
- mapping, data, stat, position, na.rm, show.legend, inherit.aes, ...
Standard geom arguments as for
ggplot2::geom_text().- padding.x, padding.y
grid::unit()object, giving horizontal or vertical padding between text and edge of tile. Defaults to 1 mm.- place
Where inside the box to place the text. Default is 'bottom'; other options are 'topleft', 'top', 'topright', etc.
- min.size
Minimum font size, in points. If provided, text that would need to be shrunk below this size to fit the box will not be drawn. Defaults to 4 pt.
- grow
If
TRUE, text will be grown as well as shrunk to fill the box.- reflow
If
TRUE, text will be reflowed (wrapped) to better fit the box.- fixed
Deprecated. Use
layout = "fixed"instead. Will be removed in later versions.- layout
The layout algorithm, one of either 'squarified' (the default), 'scol', 'srow' or 'fixed'. See Details for full details on the different layout algorithms.
- start
The corner in which to start placing the tiles. One of 'bottomleft' (the default), 'topleft', 'topright' or 'bottomright'.
Details
geom_treemap_text() requires area and label aesthetics. Several other
standard 'ggplot2' aesthetics are supported (see Aesthetics).
geom_treemap_text() uses the 'ggfittext' package to fit text to tiles. All
text drawing options available in ggfittext::geom_fit_text() (growing,
reflowing, etc.) are also available here. For full details on how these
options work, see the documentation for ggfittext::geom_fit_text().
The layout argument is used to set the treemap layout algorithm. All
'treemapify' geoms added to a plot should have the same value for layout
and start, or they will not share a common layout (see geom_treemap()
for details on the layout algorithms).
Aesthetics
area (required)
label (required)
subgroup, subgroup2 or subgroup3
colour
size
alpha
family
fontface
angle
Examples
ggplot2::ggplot(G20, ggplot2::aes(area = gdp_mil_usd,
                                  fill = econ_classification,
                                  label = country)) +
  geom_treemap() +
  geom_treemap_text()
